Our Results
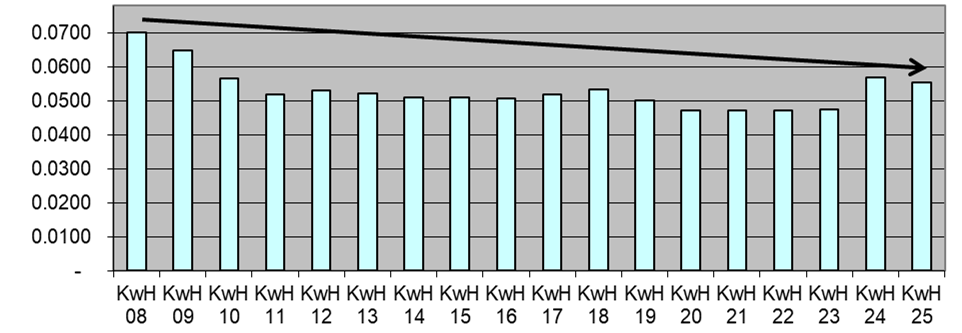
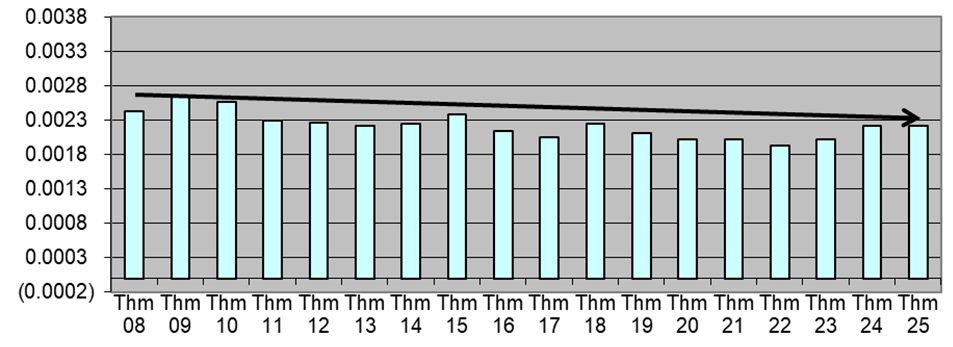
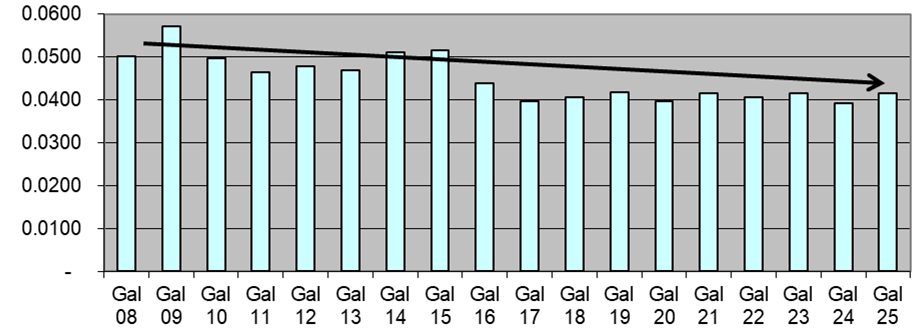
We are committed to doing our part to reduce our environmental impact. Our results over the past decade demonstrate that commitment.
Total Company Electric KwH Usage/LBS

Total Company Natural Gas Therms Usage/LBS

Total Company Water Gallon Usage/LBS

Results are inclusive of new facility purchase in FY ’24. Overall Company Usage is down since tracking began!
| Focus Area | 2025 Metric |
|---|---|
| GHG Emission – Scope 1 | 12,224 t CO2e |
| GHG Emission – Scope 2 | 14,303 t CO2e |
| GHG Emission – Scope 3 | 725,074 t CO2e |
| Packaging made with recycled material (by weight) | 45.19% |
| Recyclable Packaging (by weight) | 89.5% |
| Total energy consumption | 125,468 MWh |
| Energy consumption from renewable sources | — |
| Total water withdrawn | 45,297,581 gal |
Water Risk Analysis for All Operations*
| Low Risk | Medium-High Risk | High Risk |
|---|---|---|
| Bainbridge, GA | Elgin, IL | Gustine, CA* |
| Lakeville, MN | Huntley, IL | |
| Selma, TX |
*Analysis conducted using the World Resource Institute’s Aqueduct Water Risk Atlas
